Richest Cities in Texas (2025)
by Kristen Carney ![]()
Updated: December 17, 2024
Richest City in Texas
The richest city in Texas is Mentone in Loving County with an average household income of $625,520 as of 2023. While exceptionally affluent, Mentone only has a population of 12 as of 2023. The richest city in Texas with at least 5,000 people is Highland Park in Dallas County with an average household income of $502,823 as of 2023 and 8,642 people as of 2023 according to the most current Census data available (citation).
| Rank | City | County | Population | Average Income | Median Income |
|---|---|---|---|---|---|
| 1 | Mentone | Loving | 12 | $625,520 | $206,250 |
| 2 | Westlake | Denton; Tarrant | 1,920 | $562,426 | $250,001 |
| 3 | Hunters Creek Village | Harris | 4,352 | $548,884 | $250,001 |
| 4 | Piney Point Village | Harris | 3,067 | $510,179 | $250,001 |
| 5 | Highland Park | Dallas | 8,642 | $502,823 | $250,001 |
| 6 | Round Top | Fayette | 93 | $480,140 | $150,625 |
| 7 | Westover Hills | Tarrant | 636 | $475,943 | $250,001 |
| 8 | Hill Country Village | Bexar | 947 | $474,473 | $250,001 |
| 9 | Bunker Hill Village | Harris | 3,784 | $474,242 | $250,001 |
| 10 | West University Place | Harris | 14,791 | $409,677 | $250,001 |
| 11 | University Park | Dallas | 24,954 | $389,868 | $250,001 |
| 12 | Southlake | Denton; Tarrant | 31,137 | $382,520 | $250,001 |
| 13 | Barton Creek | Travis | 3,281 | $379,955 | $193,971 |
| 14 | Hedwig Village | Harris | 2,320 | $367,412 | $184,141 |
| 15 | Southside Place | Harris | 1,855 | $342,180 | $193,021 |
| 16 | Redfield | Nacogdoches | 500 | $324,974 | -$1 |
| 17 | Heath | Kaufman; Rockwall | 11,238 | $324,339 | $216,160 |
| 18 | Spring Valley Village | Harris | 4,272 | $323,767 | $227,857 |
| 19 | Rollingwood | Travis | 1,424 | $321,979 | $236,964 |
| 20 | Hilshire Village | Harris | 810 | $320,521 | $250,001 |
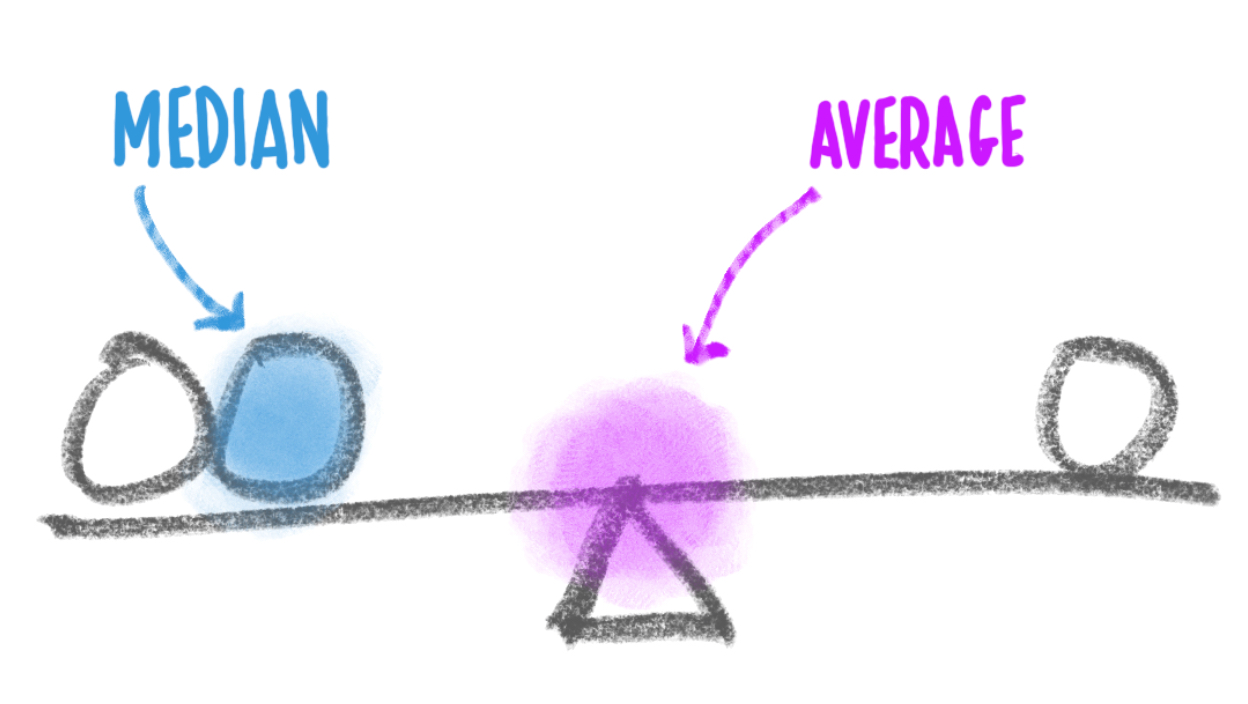
Median Income versus Average Income: Which Should You Use?
We usually suggest using median income data – either instead of or in addition to – average income data as a true indicator of wealth. If you haven’t thought about median versus average since your last standardized test, you aren’t alone. Here’s what they are:
- average is the sum of a set of numbers divided by the count of numbers in the set
- median is the middle number in the set of numbers
Now let’s say you had the following simplified set of income data.
Household 1: $30,000
Household 2: $50,000
Household 3: $1,000,000
The average income for this set is $360,000. The outlier data point ($1,000,000) skews the average WAY up. Conversely, the average income would be skewed WAY down if someone had an income of $500. The median income for the same data set is $50,000. Outlier data doesn’t skew the median.
Most Business Owners Should Use Median Income
So most business owners should use the median income as a true indicator of wealth, because it provides a more accurate representation of a typical income, especially in areas with significant income disparity.
When Should You Use Average Income
If your target market is high-income households, the average income may be more relevant. This is because the average income can highlight the presence of a higher concentration of wealthy individuals, which is beneficial for luxury goods and services marketing. We’re using average income on this page because using the Census’s highest reported median value of $250,001 could result in multiple ties for the richest geography.
Why do so many cities have a median value of $250,001?
The Census' American Community Survey uses $250,000+ as a jam value for median income estimates to protect privacy, ensure data consistency, and simplify reporting. A "jam value" in survey data refers to a placeholder or default value used when actual data points are unavailable, incomplete, or exceed certain thresholds. We represent this jam value as $250,001 to make it easy for you to sort.
You might also be interested in:
Email Me When New Data Are Released
Join thousands of subscribers and receive just 1 (ONE!) email a year in December when the US Census Bureau releases new income data for Texas richest cities.
SOURCES
United States Census Bureau. Annual Estimates of the Resident Population: April 1, 2020 to July 1, 2023. U.S. Census Bureau, Population Division. Web. May 2024. http://www.census.gov/.
United States Census Bureau. B01001 SEX BY AGE, 2023 American Community Survey 5-Year Estimates. U.S. Census Bureau, American Community Survey Office. Web. 12 December 2024. http://www.census.gov/.
United States Census Bureau. B19013 Median Household Income, 2023 American Community Survey 5-Year Estimates. U.S. Census Bureau, American Community Survey Office. Web. 12 December 2024. http://www.census.gov/.
United States Census Bureau. “DP03 SELECTED ECONOMIC CHARACTERISTICS.” 2023 American Community Survey 5-Year Estimates. U.S. Census Bureau, American Community Survey Office. Web. 12 December 2024. http://www.census.gov/.
Products & Services
Plumbing
Connect
- 1-800-939-2130
- Contact Us
© Copyright 2025 Cubit Planning, Inc.